
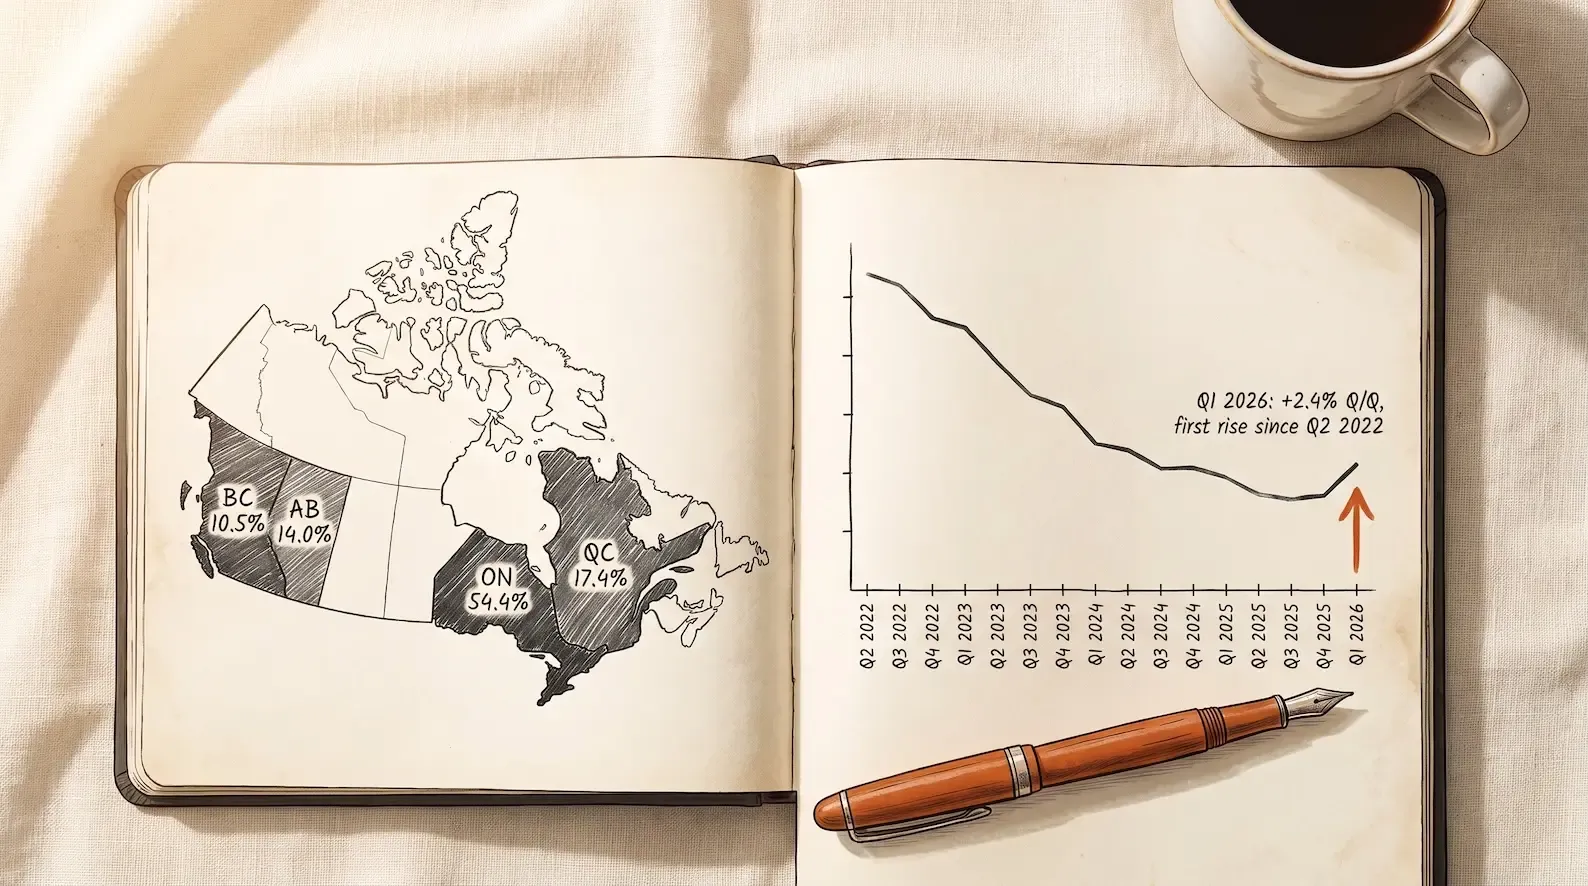
Canadian recruitment in 2026 is the largest single-country recruitment market in North America north of the United States, and one of the most sharply regulated globally. It generated $24.3 billion in employment-services operating revenue in 2024, per Statistics Canada’s Employment services 2024 release published October 2025 Source: Statistics Canada Employment services 2024. That figure represents the first annual revenue decline in the series since comparable data began in 2013, excluding 2020. It is also a market with a turning point in Q1 2026: total vacancies rose 2.4 per cent quarter-on-quarter, the first quarterly rise since Q2 2022, per the JVWS release Source: JVWS Q1 2026. Provincial variation is material, sector demand is split, and regulation reaches deeper into daily operations than in most comparable markets. This article is the fifth in a market series that already covers Singapore, Hong Kong, Australia, and the United Kingdom in 2026. Same structural approach: primary sources for every number, honest labelling of what the data covers and what it does not, and a concrete conclusion on what the Canadian recruitment CRM stack has to hold. Every claim below is anchored to Statistics Canada, ACSESS, Ontario Ministry of Labour, CNESST, OQLF, ICO, IRCC, or ESDC primary sources.
The 2026 Canadian recruitment market by the numbers
Statistics Canada’s most recent annual Employment services (NAICS 5613) release covers calendar year 2024 and was published on 17 October 2025 Source: Statistics Canada Employment services 2024. Its headline anchor figures are as follows.
- Operating revenue: $24.3 billion in 2024, down 1.7 per cent year-on-year.
- Operating expenses: $23.2 billion, down 0.8 per cent.
- Operating profit margin: 4.3 per cent.
- Establishments: 9,067 total (4,647 employers plus 4,420 non-employer or indeterminate).
- Service line split: temporary staffing 48.2 per cent, permanent placement plus contract staffing combined 42.7 per cent, other services 9.1 per cent.
- Client mix: businesses 79.6 per cent, public sector 14.2 per cent, international 4.4 per cent, individuals 1.9 per cent.
The 1.7 per cent revenue decline in 2024 is the first annual decline since the series began in 2013 excluding the pandemic year. Firm-size profile from the same source: 33.6 per cent micro (1 to 4 employees), 54.4 per cent small (5 to 99), 10.9 per cent medium (100 to 499), and 1.2 per cent large (500 or more), with 54 firms in the largest category.
The 2025 detailed Statistics Canada release had not been published as of early September 2026. The next best macro proxy is IBISWorld’s Employment & Recruiting Agencies in Canada industry report, which estimated the market at $11.4 billion for 2026 (vendor-reported, carried forward from an August 2025 publication) Source: IBISWorld industry page. IBISWorld’s segmentation is not directly comparable to Statistics Canada’s NAICS 5613 aggregate. Neither is a fresh 2026 measurement of the entire sector.
ACSESS, the Association of Canadian Search, Employment and Staffing Services, publishes the Canadian Staffing Index of billed temporary and contract hours, benchmarked to 100 in July 2008. The June 2026 reading was 92, up 8.2 per cent year-on-year from 85 Source: ACSESS Canadian Staffing Index. ACSESS reports 400 corporate members and 1,500 plus branch offices (association-reported).
The Q1 2026 turning point in vacancies
Statistics Canada’s JVWS Q1 2026 release recorded total Canadian vacancies at 506,700, up 11,800 (2.4 per cent) quarter-on-quarter, the first quarterly rise since Q2 2022 Source: JVWS Q1 2026. Vacancies remained down 3.2 per cent year-on-year, an improvement from the 8.8 per cent annual decline recorded the prior quarter. The vacancy rate was 2.8 per cent, unchanged in the quarter and down 0.1 percentage points year-on-year. Long-term vacancies (open 90 days or more) fell to 28.0 per cent of all vacancies, from 31.2 per cent in Q1 2025.
By vacancy type in Q1 2026, permanent roles rose 1.8 per cent and temporary roles rose 5.0 per cent, indicating the pickup is stronger in the flexible workforce that Canadian staffing agencies serve most directly. The unemployment-to-vacancy ratio was 3.0 overall, tightening to 5.0 for roles requiring a bachelor’s degree or higher. Average offered hourly wages were $29.55, up 2.2 per cent year-on-year (up 3.2 per cent on a composition-constant basis).
A newer preliminary monthly reading for June 2026, published August 2026, put vacancies at 509,100 at a 2.8 per cent rate and 2.9 unemployed persons per vacancy Source: Payroll employment and vacancies June 2026. Q2 2026 JVWS data was scheduled for release 15 September 2026 and was not yet available at the time of this research.
The August 2026 LFS release adds a note of caution. Employment fell 42,000 in the month (down 0.2 per cent) after four consecutive months of gains totalling 181,000, with the unemployment rate holding at 6.4 per cent Source: LFS August 2026. Wage growth decelerated to 2.0 per cent year-on-year from 2.8 per cent in July and 3.3 per cent in June. Business, building, and other support services (the sector that contains staffing agencies) fell 20,000 (down 2.8 per cent), the largest monthly sector decline. The vacancy recovery is real; the employment picture is choppier.
Provincial variation: Canada is national in scale, provincial in practice
Employment-services revenue is highly provincially concentrated. In 2024, Ontario was 54.4 per cent of the total, Quebec 17.4, Alberta 14.0, and British Columbia 10.5, with the four largest provinces accounting for 96.3 per cent of national revenue Source: Statistics Canada Employment services 2024. Establishment counts confirm the concentration: Ontario 2,449 employer establishments, Quebec 1,128, British Columbia 452, and Alberta 384, plus 233 across the smaller provinces and territories.
Q1 2026 vacancy movement was similarly uneven. Ontario recorded 177,300 vacancies (up 8,800 quarter-on-quarter), Quebec 113,600 (down 3,900, the only provincial decline), British Columbia 82,800 (up 4,100), and Alberta 64,100 (up 2,900). Yukon rose 200 to 900 vacancies. Manitoba, Saskatchewan, and the Atlantic provinces were described as little changed and were not published at level detail in the release.
The August 2026 LFS provincial picture also diverged. Quebec fell 19,000 (down 0.4 per cent), with the Montreal CMA down 21,000; Quebec was the only province down year-on-year at down 1.2 per cent. Ontario fell 18,000 in the month but was up 116,000 year-on-year. New Brunswick rose 2,400. All other provinces were little changed. Toronto CMA unemployment was 6.7 per cent, Montreal 6.5 per cent, and Alberta as a province stood at 7.2 per cent against the national 6.4 per cent.
The commercial reading is that Canadian recruitment operates at national scale but the operating cycle is provincial. An Ontario desk saw a vacancy rise and an employment slip in the same quarter. A Quebec desk saw vacancy contraction and employment decline. A British Columbia desk saw vacancy growth and holding employment. Agency dashboards and BD prioritisation that treat Canada as one market will misread all four in the same month. This is the same pattern documented in the Australia 2026 and UK 2026 pieces: a national headline that masks materially different regional cycles.
Sector concentration and the health-versus-hiring paradox
Q1 2026 vacancy movement by occupation, per the JVWS release, shows sales and service occupations up 8,400 (5.8 per cent) to 153,000 (the first rise since Q4 2021), trades and transport up 4,900 (5.3 per cent), and natural and applied sciences up 1,500 (4.0 per cent). Health occupations fell 3,300 (5.0 per cent) to 62,700, the lowest level since Q1 2020, and were down 16.0 per cent year-on-year, the steepest annual decline of any occupational group.
The paradox is that Statistics Canada’s LFS shows health care and social assistance employment growing 129,000 (4.5 per cent) in the twelve months to August 2026, the largest sector employment gain Source: LFS August 2026. Falling vacancies plus rising employment in the same sector is the signature of a market where employers are hiring faster than they are posting new needs, absorbing existing candidate supply. It is not evidence of collapsing healthcare demand. Structurally, health-related vacancies were 15.0 per cent of all Canadian vacancies in 2024, up from 6.5 per cent in 2016, per a separate Statistics Canada study on regional dynamics of health vacancies Source: Statistics Canada Regional dynamics of health vacancies 2024.
The monthly June 2026 JVWS release provides sector-level growth detail: vacancies up year-on-year in manufacturing (17.3 per cent), mining, quarrying, and oil and gas (42.3 per cent from a small base), professional, scientific, and technical services (9.1 per cent), and retail trade (8.3 per cent); down in educational services (10.9 per cent) and information and cultural industries (13.2 per cent).
Two sector claims commonly repeated about Canadian recruitment do not have primary-source support and are omitted here. There is no verified figure for Toronto’s share of Canadian recruitment revenue: the most granular official figure is provincial (Ontario 54.4 per cent), not city-level. There is no verified agency-specific placement data for Alberta’s resource sector: JVWS gives the sector-level vacancy movement, but agency involvement is not separately measured.
The verified seasonality: correcting the Q4 and January myths
Two folklore claims about Canadian hiring seasonality do not hold up to primary evidence.
First, the claim that Canadian hiring shuts down in Q4. LinkedIn’s Economic Graph shows Canadian job postings peaking in October at 22 per cent above the March baseline, with November still elevated at 14 per cent, and only December falling to 2 per cent below March Source: LinkedIn Economic Graph Labor Market Seasonality, August 2025. Indeed Hiring Lab Canada confirms that Canadian seasonal recruiting starts in September and peaks at the end of October, with seasonal postings up 12 per cent year-on-year as of 4 November 2025 Source: Indeed Hiring Lab Canada, November 2025. The genuine slowdown is specifically the last two weeks of December, where LinkedIn measures the hiring rate down 43 per cent and job transitions down 42 per cent versus March, and Indeed measures job-seeker applications down 43 per cent and searches down 38 per cent in the week of 27 December 2025.
Second, the claim that January is when Canadian employers post the most jobs. This misreads which side of the market is moving. LinkedIn’s data shows January job postings down 1 per cent versus March, while the hiring rate is up 58 per cent and job transitions are up 30 per cent. Indeed Hiring Lab Canada calls the pattern the January Jump: Canadian job-seeker searches rise 19 per cent above late-November levels in early January, and applications nearly double from late-December levels Source: Indeed Hiring Lab Canada, March 2026. The defensible framing is that January is a candidate-supply and job-change pulse, not a job-advertising pulse.
The operational implication for a Canadian recruitment desk is that Q1 planning should assume a large January inflow of candidate applications against a broadly flat job-posting base, and Q4 planning should assume October is the year’s advertising peak with a genuine, but narrow, two-week December collapse rather than a three-month slowdown.
Regulation shaping the Canadian recruitment CRM stack in 2026
Canadian regulation reaches deeper into recruitment CRM design than in most comparable markets, and 2026 is a year in which four specific rule sets are binding.
Ontario Temporary Help Agency and recruiter licensing. Since 1 July 2024, THAs must be licensed to operate in Ontario and recruiters must be licensed to act as recruiters, under O. Reg. 99/23 made under the Working for Workers Act 2022 Source: Ontario Licensing for THAs and recruiters. Licensing is triggered by the placement, not the agency’s location: an overseas or out-of-province agency placing into Ontario needs an Ontario licence. Fees rose to $1,500 on 1 January 2026 (from $750) under O. Reg. 233/25, with a licence term of about two years. THA licences require a $25,000 security in the form of an irrevocable letter of credit or surety bond. Retention requirement: three years for hours records, assignment details, and worker-facing documents, held so as to be available for inspection even if kept by a third party. Penalties: notices of contravention of $15,000 for first offence, $25,000 for second within three years, and $50,000 for third within three years, with prosecution up to $100,000 for individuals and $500,000 for corporations with prior convictions under Employment Standards Act s. 132.
The Ontario 2026 job-posting rules, in force 1 January 2026, add specific CRM feature requirements for employers with 25 or more employees: publicly advertised job postings must disclose an expected compensation or range (capped for high-salary ranges), disclose whether AI is used to screen, assess, or select applicants, disclose whether an existing vacancy exists, and omit any Canadian-experience requirement. Interviewed applicants must be told within 45 days whether a hiring decision was made. Retention: every posting, application form, linked material, and revision for three years after the posting is taken down, plus all information given to interviewed applicants for three years. Critically, the employer remains responsible even where a recruiting firm does the AI screening Source: Ontario Requirements related to publicly advertised job postings, updated February 2026.
Quebec CNESST agency permit. Under Bill 176 (2018) and the Regulation respecting personnel placement agencies (N-1.1, r. 0.1), any business offering personnel-placement services in Quebec requires a CNESST licence, and clients may not retain an unlicensed agency Source: CNESST Obligations. The 2025 permit fee was $1,065, indexed annually. Security: $15,000 surety bond. Retention: six years for client contracts, invoices, and daily-and-weekly hours worked per assigned employee. Display: licence number on invoices, contracts, website, and advertising. The permit applies regardless of home province, and CNESST publishes a public register that identifies suspended or invalid agencies.
Quebec Bill 96 French-language obligations. Any business employing 25 or more people in Quebec for six months must register with the OQLF within six months of that period ending, per Québec.ca guidance updated August 2026 Source: Québec.ca. Job ads, individual employment contracts, employment application forms, working-condition documents, and training documents must be drafted in French. Software (including operating systems) must be available in French where a French version exists, per OQLF guidance updated 2026. The 25-to-49 employee band entered this regime on 1 June 2025, affecting roughly 20,000 Quebec businesses. The commonly repeated claim that Bill 96 requires all workplace software to be in French is narrower than typically stated: the obligation attaches where a French version exists.
PIPEDA plus provincial privacy. PIPEDA governs private-sector handling of personal information in commercial activity across Canada, including recruiter opinions, evaluations, and intentions such as an intention to change jobs Source: OPC PIPEDA requirements in brief. Alberta, British Columbia, and Quebec laws are deemed substantially similar and take precedence for in-province activity. Quebec Law 25 adds requirements beyond PIPEDA: a published privacy officer, published governance policies, an incident register, privacy impact assessments before system acquisition or overhaul and before any cross-border data transfer, purpose-by-purpose separated express consent for sensitive data, privacy-by-default settings, automated-decision disclosure, and data portability. Penalties under Law 25 reach 2 per cent of worldwide turnover or $10 million, whichever is greater. This is a materially higher-stakes regime than PIPEDA’s $100,000 statutory maximum.
LMIA and Temporary Foreign Worker Program compliance. Employers must retain LMIA-related records for six years from the first day of the LMIA-authorised employment period Source: ESDC Employer compliance. Inspections can examine treatment of workers up to six years back, without a warrant, testing 29 conditions. Penalties reach $100,000 per violation, capped at $1 million per year, plus LMIA suspension or revocation, public listing as non-compliant, and permanent bans. Enforcement in the trailing year (1 April 2025 to 31 March 2026) issued more than $10.2 million in monetary penalties, up from $4.5 million the prior year, finalised 1,488 inspections, found 12 per cent of inspected employers non-compliant, and banned 30 employers.
The Canadian recruitment CRM stack an agency actually needs
Pulling the market data, the provincial variation, and the regulatory picture together produces a specific set of Canadian recruitment CRM requirements for 2026.
| Requirement | Why it matters in Canada specifically | What breaks without it |
|---|---|---|
| Distinct permanent and contract-and-temp workflows | Statistics Canada shows temporary staffing was 48.2 per cent of Canadian employment-services revenue in 2024; Ontario and Quebec licensing regimes carry retention and audit duties that apply differently to each engagement type | Single ‘placement’ record type fails Ontario ESA and Quebec CNESST inspection |
| Provincial licensing record structure | Ontario THA and recruiter licence, CNESST permit, BC employment agency licence, and BC foreign worker recruiter licence are all separate, with different fees, security, terms, and retention | Multi-province desks cannot demonstrate current licence status per placement jurisdiction |
| Ontario 2026 job-posting audit trail | Compensation disclosure, AI-screening disclosure, existing-vacancy disclosure, and 45-day applicant notification all require three-year retention of the posting, application form, and linked material | Non-compliance exposure at ESA inspection; the employer client remains responsible even where the agency did the screening |
| French-language CRM UI and templates where required | Quebec Bill 96 obligations attach at 25 employees in Quebec; software must be available in French where a French version exists | Agency risks OQLF non-compliance at 25-employee threshold |
| Quebec Law 25 data-governance controls | PIA before cross-border data transfer, published privacy officer, incident register, automated-decision disclosure, data portability | Turnover-linked administrative monetary penalties up to 2 per cent of worldwide turnover or $10 million |
| LMIA and TFWP record retention for six years | Inspections can examine records up to six years back, without warrant, testing 29 conditions | Penalties up to $100,000 per violation, permanent bans for the most serious cases |
| Provincial visibility that can shift between national and provincial granularity | Ontario 54.4 per cent of revenue but Q1 2026 vacancy movement diverged materially by province | National KPIs conflate divergent provincial desks; capacity and BD misallocated |
The provincial and regulatory picture is where the AI-native architectural argument becomes concrete. The Perfect Memory pillar is what keeps the record complete across email, calendar, calls, WhatsApp, and LinkedIn conversations that a Canadian recruiter has in a given week, so that later Ontario ESA, Quebec CNESST, or ESDC inspections can trace the audit chain from first candidate contact to placement. The contract-and-temp workflow separation is what distinguishes an LMIA-authorised placement from a permanent placement so that six-year retention and 29-condition inspection readiness are structural properties of the record, not tasks to be done under time pressure. And hiring-intent signal detection is what tells a Canadian BD lead which of the agency’s client base is in the growing half of the market (manufacturing, mining, professional services, retail) and which is in the softening half (educational services, information and cultural industries), given the sector split in the June 2026 JVWS release.
For a wider frame on how to evaluate any AI-native recruitment CRM without getting distracted by feature bingo, our recruitment CRM buyer’s guide for 2026 walks through the Five Dimensions of AI-Native Evaluation. The Singapore 2026, Hong Kong 2026, Australia 2026, and UK 2026 pieces cover the equivalent market-shaped requirements for the four other regions Signals is built for. Together with this Canada piece, the five articles specify the market-specific realities that any AI-native recruitment CRM has to hold as first-class design constraints, not as configuration options.
Canadian recruitment in 2026 is a market where the regulatory shape of the CRM matters as much as the market-cycle shape of the desk. An agency operating on a generic global CRM configured for a US or European single-national-cycle assumption, without the Ontario licensing audit trail, the Quebec French-language obligations, the Quebec Law 25 data-governance controls, and the LMIA retention structure the Canadian market actually requires, is taking a compliance risk that will surface at the wrong moment. A CRM designed for the Canadian market can support the audit trail natively; a CRM that treats Canada as a US equivalent cannot.
Run a Canadian desk on a CRM that fits Canadian regulation and provincial variation
Signals is live for recruitment agencies globally. Book a demo to see the Canada-fit CRM stack.
Common questions
Statistics Canada's Employment services (NAICS 5613) sector generated $24.3 billion in operating revenue in 2024, down 1.7 per cent year-on-year, the first annual revenue decline since comparable data began in 2013 excluding 2020, per Statistics Canada's Employment services 2024 release published October 2025 [Source: Statistics Canada Employment services 2024](https://www150.statcan.gc.ca/n1/daily-quotidien/251017/dq251017c-eng.htm). The sector operated across 9,067 establishments (4,647 employers plus 4,420 non-employer). Provincial concentration was Ontario 54.4 per cent, Quebec 17.4 per cent, Alberta 14.0 per cent, and British Columbia 10.5 per cent of revenue. IBISWorld's Employment & Recruiting Agencies in Canada report published in August 2025 estimates the market at $11.4 billion for 2026 (vendor-reported); the two figures are not directly comparable because IBISWorld's segmentation differs from Statistics Canada's NAICS 5613 aggregate. 2025 detailed figures from Statistics Canada had not been released as of early September 2026.
Canadian vacancies were 506,700 in Q1 2026, per Statistics Canada's Job Vacancy and Wage Survey (JVWS) Q1 2026 release published 16 June 2026 [Source: Statistics Canada JVWS Q1 2026](https://www150.statcan.gc.ca/n1/daily-quotidien/250616/dq250616a-eng.htm). Vacancies rose 11,800 (2.4 per cent) quarter-on-quarter, the first quarterly increase since Q2 2022, while remaining down 3.2 per cent year-on-year. The vacancy rate was 2.8 per cent, unchanged in the quarter. Provincially, Ontario had 177,300 vacancies (up 8,800), Quebec 113,600 (down 3,900, the only provincial decline), British Columbia 82,800 (up 4,100), and Alberta 64,100 (up 2,900). A newer preliminary monthly reading for June 2026 recorded 509,100 vacancies at a 2.8 per cent rate [Source: Statistics Canada Payroll employment and vacancies June 2026, August 2026](https://www150.statcan.gc.ca/n1/daily-quotidien/260827/dq260827a-eng.htm). Q2 2026 JVWS data was scheduled for release 15 September 2026 and was not yet available.
Yes. Ontario's Temporary Help Agency (THA) and recruiter licensing regime, in force since 1 July 2024 under the Working for Workers Act 2022 and O. Reg. 99/23, applies based on where the placement lands, not on where the agency is located [Source: Ontario Licensing for temporary help agencies and recruiters, 2024](https://www.ontario.ca/page/licensing-temporary-help-agencies-and-recruiters). Licensing is triggered by assigning employees to work in Ontario or by finding employment or employees in Ontario, regardless of the agency's own address. Each legal entity applies separately. Fees rose to $1,500 for applications on or after 1 January 2026 under O. Reg. 233/25, with a licence term of about two years. THA licences require a $25,000 security. Penalties for operating unlicensed range from $15,000 to $50,000 per notice of contravention and up to $500,000 on prosecution for repeat corporate offenders under Employment Standards Act s. 132. Client employers are also prohibited from knowingly using unlicensed agencies.
The commonly repeated claim that Bill 96 requires all workplace software to be in French is narrower than typically stated. Quebec's Charter of the French Language, as amended by Bill 96, requires software (including operating systems) to be made available in French where a French version exists, and it imposes a general French-generalisation obligation on businesses with 25 or more employees in Quebec, per Québec.ca and OQLF guidance [Source: Québec.ca, updated August 2026](https://www.quebec.ca/); [Source: OQLF, updated June 2026](https://www.oqlf.gouv.qc.ca/). The 25 to 49 employee band entered this regime on 1 June 2025, affecting roughly 20,000 Quebec businesses. Practical CRM implications for an agency with 25 or more staff in Quebec: job ads, application forms, individual employment contracts, working-condition documents, and training documents must be drafted in French, and the CRM interface should be available in French where a French version exists. Registration with the OQLF is required within six months of exceeding 25 staff in Quebec for six months.
LMIA and Temporary Foreign Worker Program non-compliance carries penalties of up to $100,000 per violation, capped at $1 million per year, plus LMIA suspension or revocation, public listing as non-compliant, and permanent bans for the most serious violations, per Employment and Social Development Canada [Source: ESDC Employer compliance](https://www.canada.ca/en/employment-social-development/services/foreign-workers/employer-compliance.html). Employers must retain all relevant records for six years from the first day of the LMIA-authorised employment period. Enforcement in the trailing year (1 April 2025 to 31 March 2026) issued more than $10.2 million in monetary penalties (versus $4.5 million the prior year), finalised 1,488 inspections, found 12 per cent of inspected employers non-compliant, and banned 30 employers [Source: ESDC news release, July 2026](https://www.canada.ca/en/employment-social-development.html). Example penalties included $240,000 with a five-year ban for a Manitoba trucking firm, $122,000 with a five-year ban for a Quebec consulting firm, and $126,000 with a two-year ban for a Nova Scotia restaurant.